
Logging agents collect, transform and send log event data to a centralized location for analysis. This blog will focus on Vector logging agent for log ingestion in the Parseable log analytics engine.
Log agents are the critical first components in the overall logging pipeline of an organization. They collect, transform and send log event data to a centralized location for analysis. In this post we'll focus on Vector, a high-performance, open-source log agent for log ingestion in the Parseable log analytics engine.
Parseable is a lightweight, cloud-native log observability engine written in Rust. Please refer to the Introduction to Parseable blog for more details.
What is Vector?
Vector is a lightweight and high-performance tool for building observability pipelines. It is a unified system that supports collecting logs and metrics data into a structured representation of an event at any point in time. Vector is written in Rust and is designed to be fast, reliable, and secure.
Vendor neutrality, rich data model, and highly configurable transforms with the Vector Remap Language are the core principles of Vector.
Components
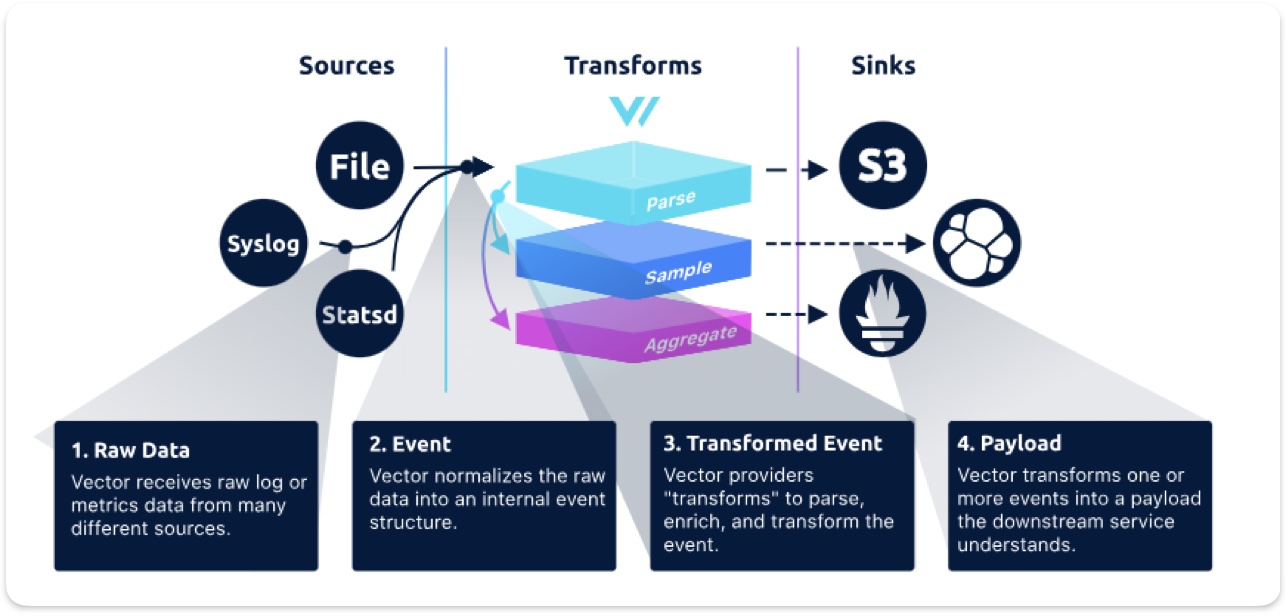
There are three major components serving specific purposes.
Sources: Vector supports several sources. Each source is literally a source of observability data. Source component allows users to collect observability data from different sources such as Kubernetes logs, NGINX metrics, OpenTelemetry etc.
Transforms: Transforms allow operating on the data collected from the source (before it is sent over). In this step, you can filter, route, remap, throttle the data, before sending to a sink.
Sinks: This is where Vector sends the data after previous steps. Parseable for example a sink for Vector. Vector supports several sinks.
Vector Deployment Roles
Vector can be deployed in two different roles: Agent and Aggregator. Agents are lightweight instances deployed on each host to collect and forward logs to either an Aggregator or a centralized log management system. Agents can run as sidecars or as daemonsets in Kubernetes clusters. Agents offer a simple and efficient way to collect logs from multiple sources and forward them to a centralized location.
Setup Logging Pipeline with Vector and Parseable
In this section, we will setup a logging pipeline with Vector and Parseable. We will use Vector as an agent to collect logs from a Kubernetes cluster and send them to Parseable for analysis. Finally, we'll visualize this data with the help of the Parseable data source plugin in a Grafana dashboard.
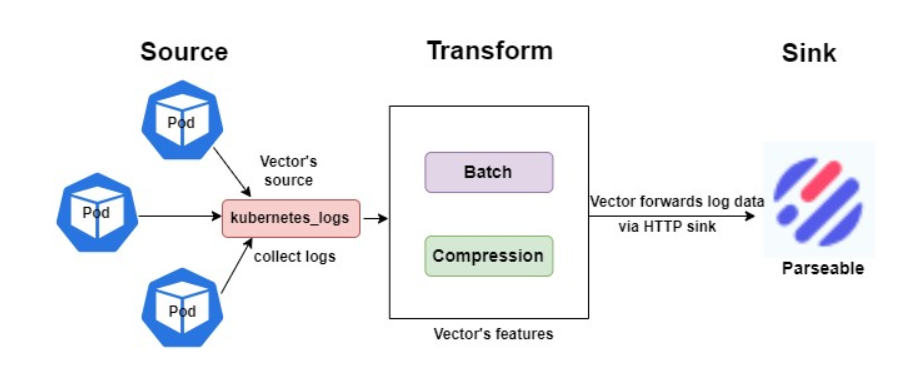
- First, Vector's
kubernetes_logssource will collect the logs from all Kubernetes pods. We'll run Vector as a DaemonSet. - Then, we'll decrease the number of HTTP requests and payload size using Vector's feature batch and compression.
- Last, we will use the HTTP sink to deliver the logs to Parseable.
Pre-requisites
A Kubernetes cluster with your kubectl and helm configured to point to it.
Install Parseable
Create a secret file with configuration for Parseable. Make sure to change the username and password to your desired values.
cat << EOF > parseable-env-secret
addr=0.0.0.0:8000
staging.dir=./staging
fs.dir=./data
username=admin
password=admin
EOF
Create a namespace for Parseable and create the secret.
kubectl create ns parseable
kubectl create secret generic parseable-env-secret --from-env-file=parseable-env-secret -n parseable
Install Parseable using the Helm chart.
helm repo add parseable https://charts.parseable.com
helm install parseable parseable/parseable -n parseable --set "parseable.local=true"
Export the Parseable server so you can access it from your browser at http://localhost:8000. Use the credentials provided in the secret file above as username and password to log in.
kubectl port-forward svc/parseable 8000:80 -n parseable
Install Vector
We’ll install Vector via Helm. We’ll use values.yaml file that has the configuration details for the vector source and sink.
wget https://www.parseable.com/blog/vector/values.yaml
While most of the values.yaml file content is self-explanatory, I’d like to highlight the batch section. Batch section allows configuring Vector to batch i.e. combine several log events in a single HTTP call. This allows sending much more data over a single HTTP call. Also the compression section allows setting relevant compression algorithms for the HTTP payload.
These two combined, allow a much efficient way to push logs to Parseable over HTTP.
helm repo add vector https://helm.vector.dev
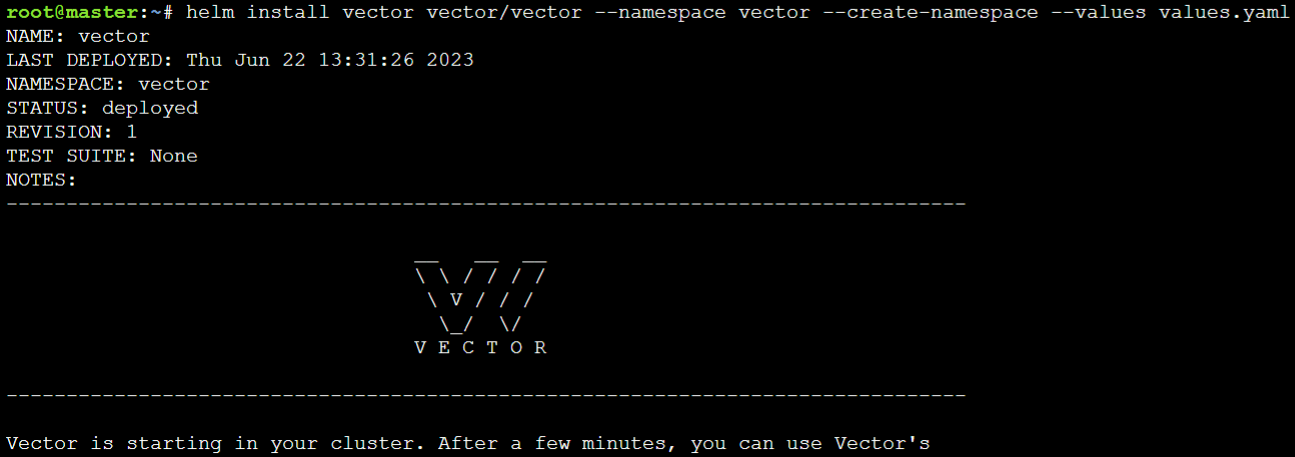
helm install vector vector/vector --namespace vector --create-namespace --values values.yaml
You should see an output like below.
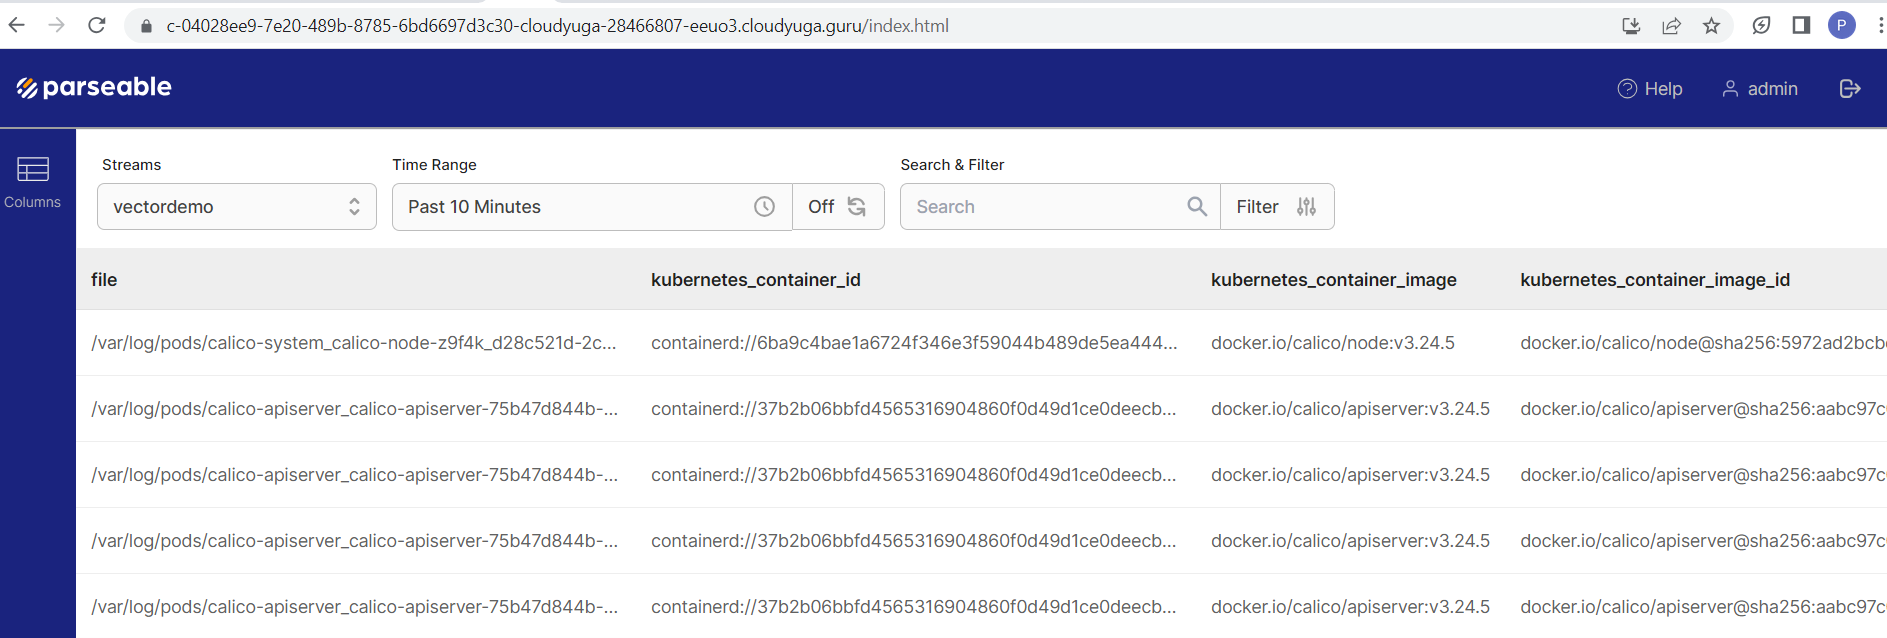
Vector should now start to collect logs from the pods in the vectordemo log stream. The vector log stream is created through request headers.
To view the logs in Parseable UI, Refresh the browser at http://localhost:8000, which we accessed in the previous sub-section.
Install Grafana and Parseable Data Source Plugin
Grafana is designed to store and query logs from all our applications and infrastructure. We'll install Grafana using Helm to configure the Parseable datasource plugin to better visualize Parseable server data.
helm repo add grafana https://grafana.github.io/helm-charts
helm install grafana grafana/grafana \
--namespace grafana \
--create-namespace
Use the below command to get the password for the admin Grafana user.
kubectl get secret --namespace grafana grafana -o jsonpath="{.data.admin-password}" | base64 --decode ; echo
Next, we'll install the Parseable datasource plugin for Grafana.
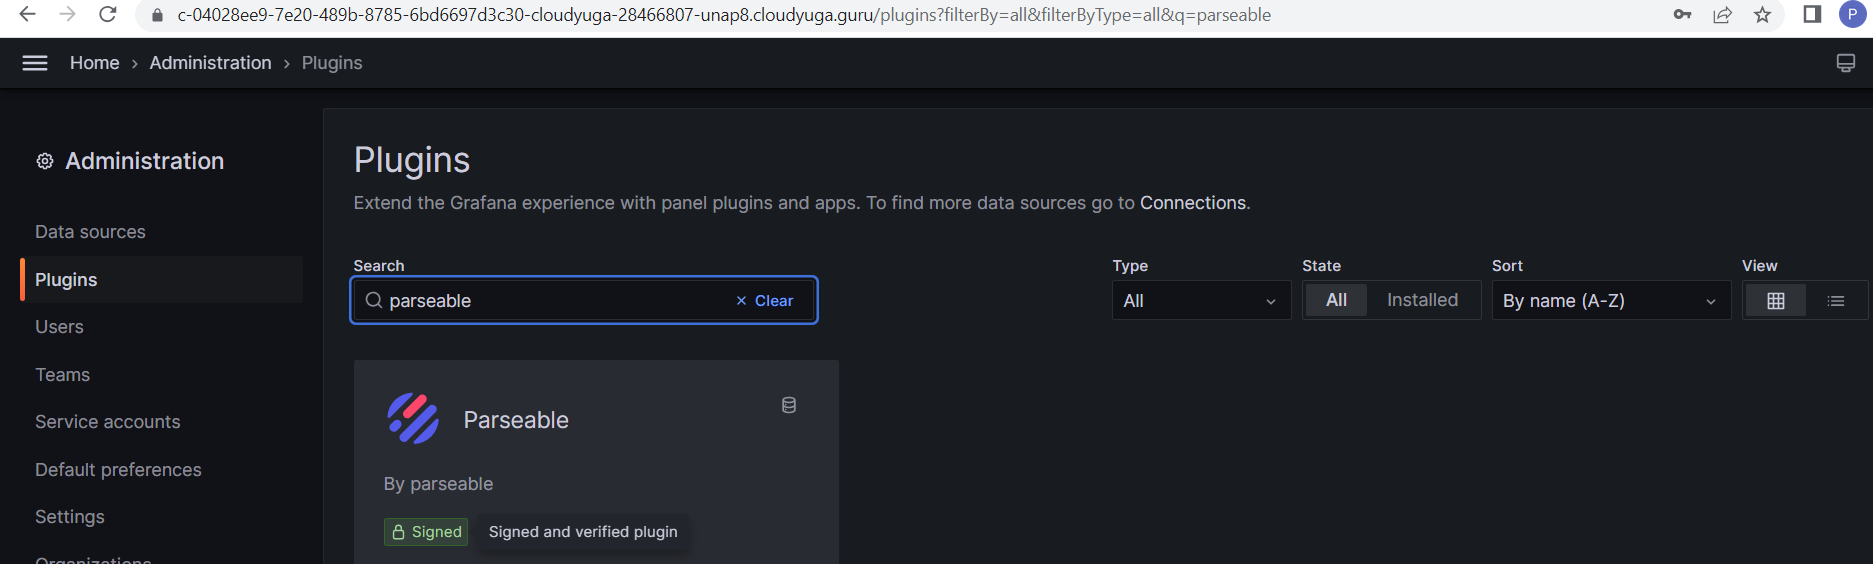
- Click on Add your first data source on the home page of Grafana and search for parseable Plugin under the Plugins section. Click on it and Install it.
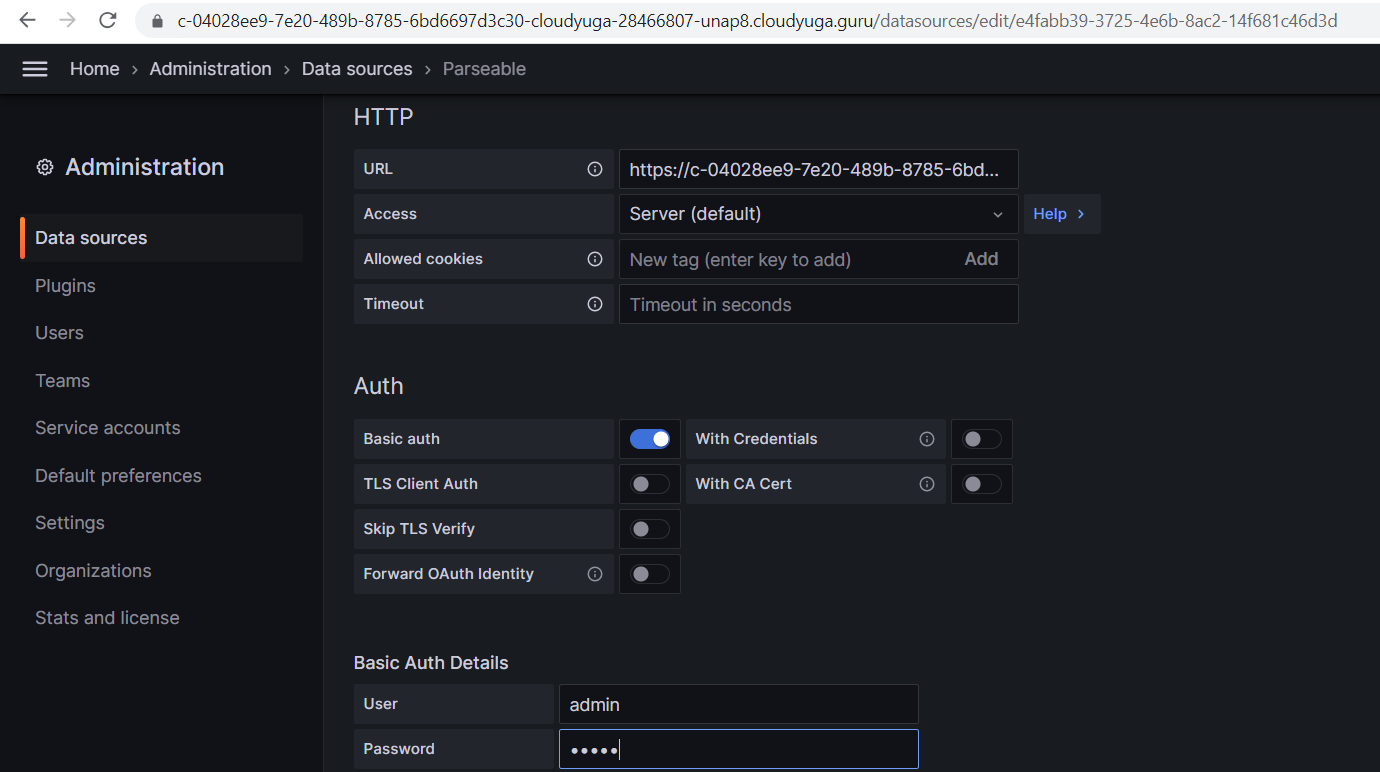
- After installation, Click on Create a Parseable data source button and add Parseable server details.
- Now, Provide the Parseable URL. Since both Parseable and Grafana are running in the same Kubernetes cluster, we can use the service name
parseableas the URL. - Enable Basic Auth and provide Parseable server credentials. Click on the save & test button.
- Select logstream, which is added with parseable to view the details like column names, event count, etc. In this case we'll use the stream
vectordemo.
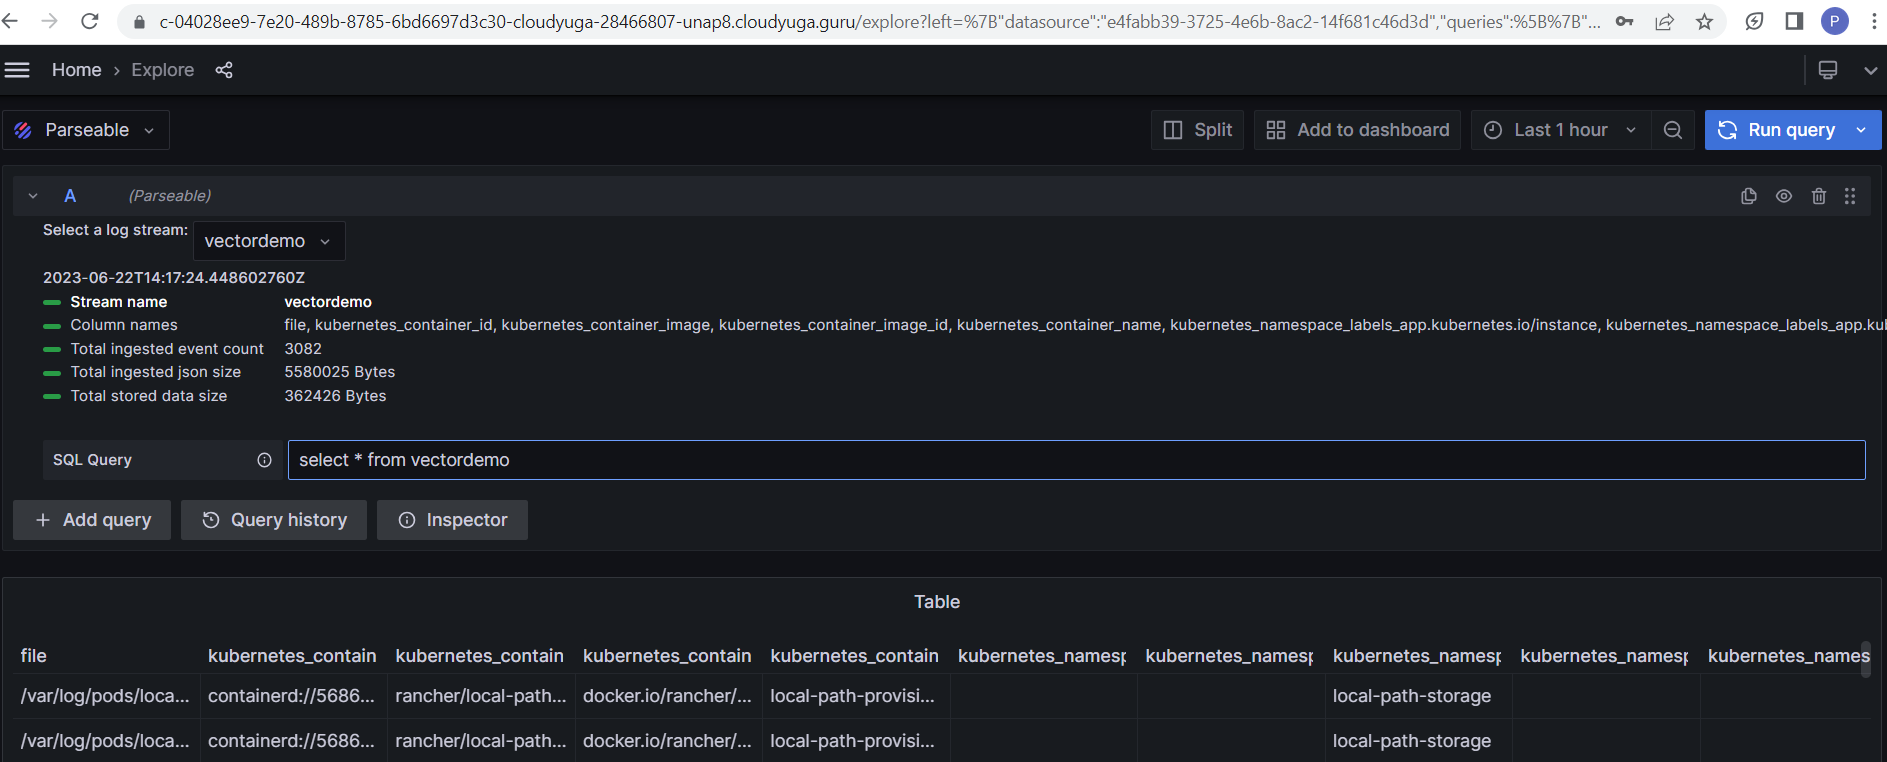
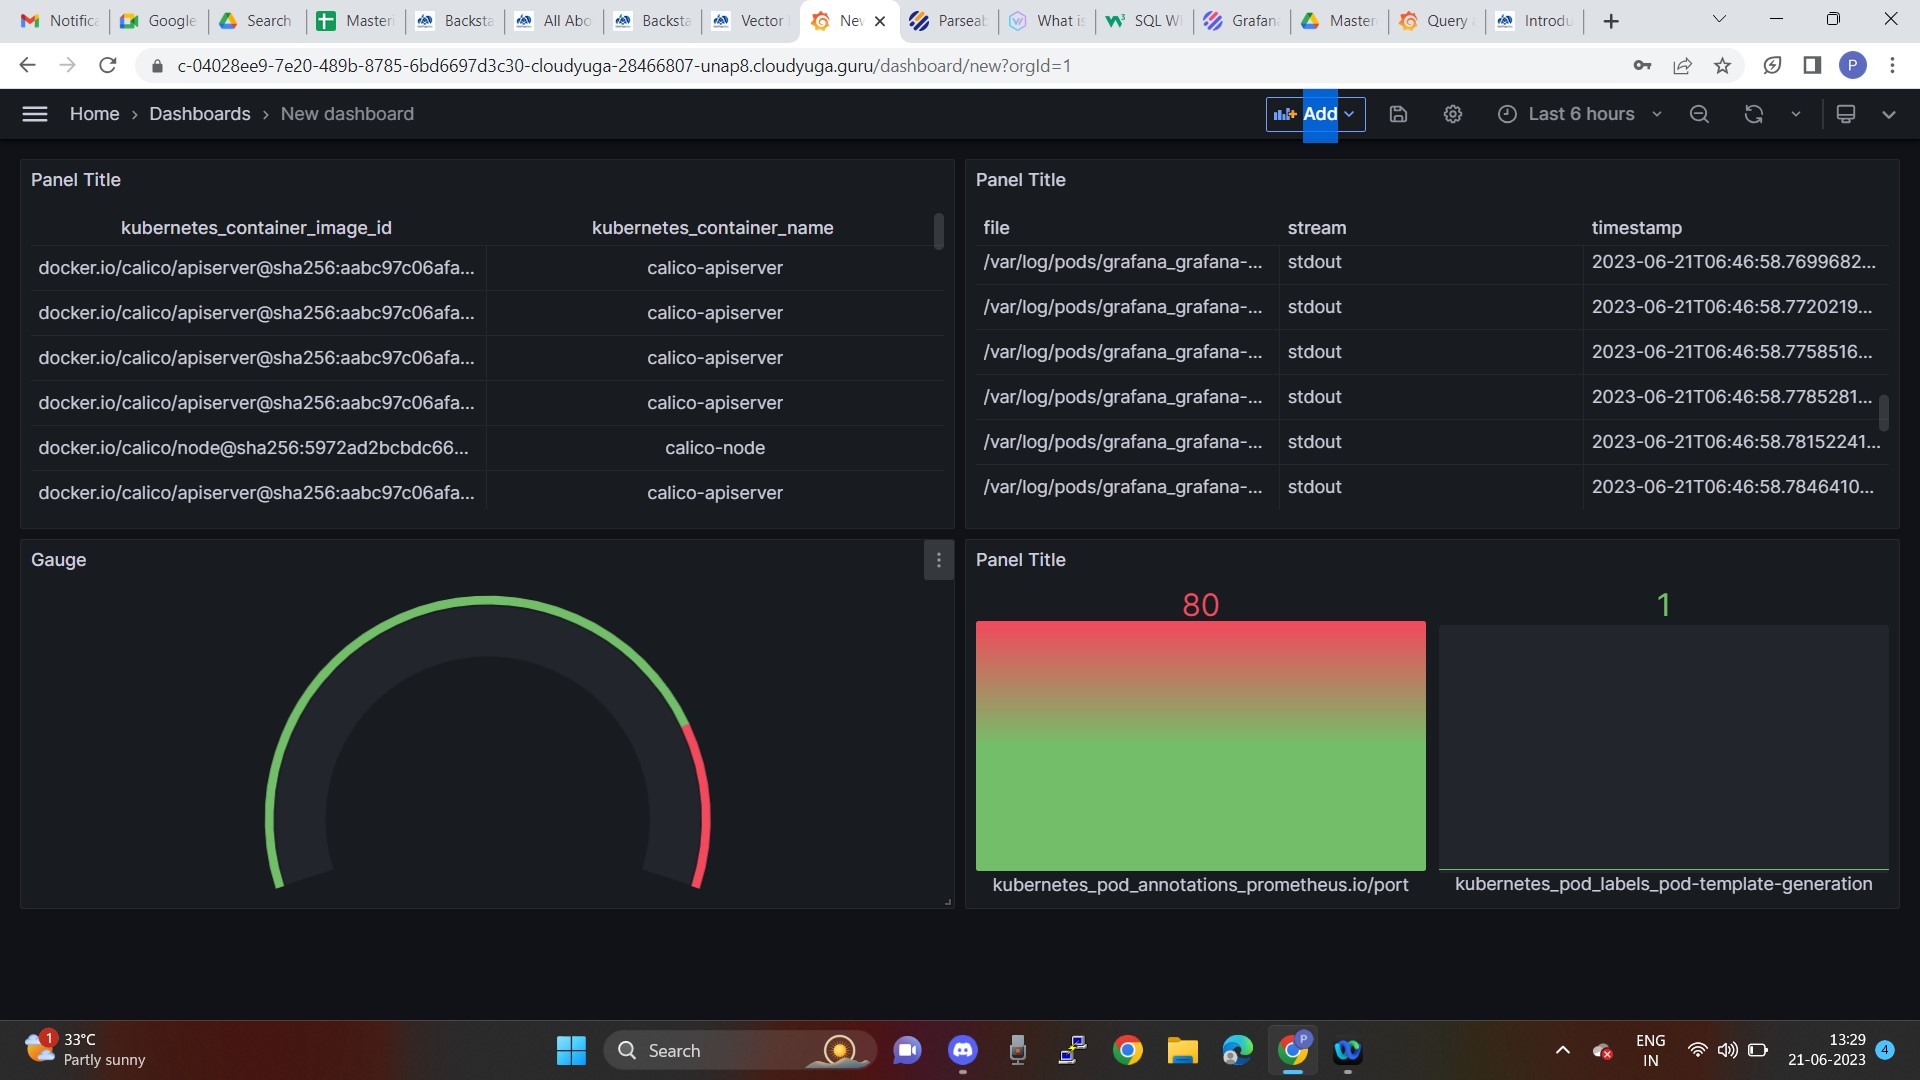
You can now create a dashboard with the data from Parseable.
Conclusion
In this article, we learned how to setup a logging pipeline with Vector and Parseable. We used Vector as an agent to collect logs from a Kubernetes cluster and send them to Parseable for analysis. Finally, we visualized this data with the help of the Parseable data source plugin in a Grafana dashboard.
We hope you found this article useful. If you have any questions or feedback, please reach out to us at Parseable Slack Community here