
While working with Kubernetes, Developers and DevOps engineers need to know how to troubleshoot and find issues in the application. Logs are one of the key aspects for identifying issues and failures.
Introduction
Kubernetes, an open-source container orchestrator, is designed to manage and deploy applications at scale. While working with Kubernetes, Developers and DevOps engineers should know how to troubleshoot clusters and find issues in the application using logs. Due to its dynamic nature, it is challenging to centralize logs for monitoring.
In this post, we will go over complete overview of how logging works in Kubernetes. We briefly introduce some of the Kubernetes logging solutions. Finally, we'll look at Parseable and learn how it helps centralizing Kubernetes logs.
What is Logging in Kubernetes?
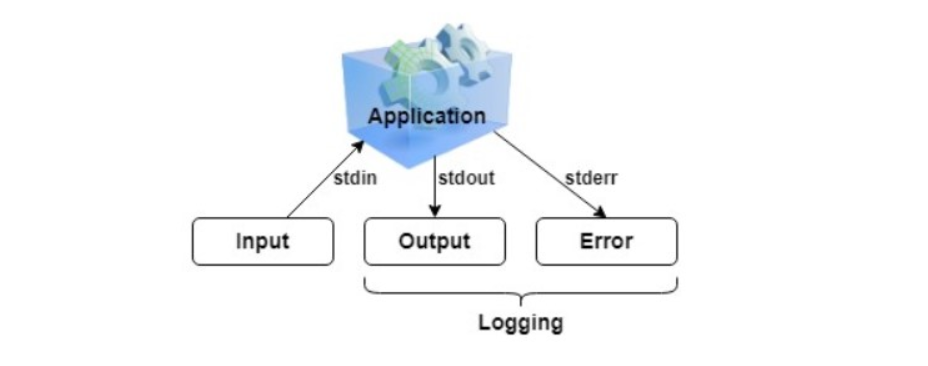
In general computing, logging means a written record of events or operations in a computer system. For example, at an application level, it generates logs when an event occurs or affects the application.
In Kubernetes context, this becomes pretty complex. There are different levels of abstractions - physical nodes (servers), operating systems, pods, containers, and applications. Each of these layers generates logs, and it is challenging to store, manage, and analyze all of these efficiently.
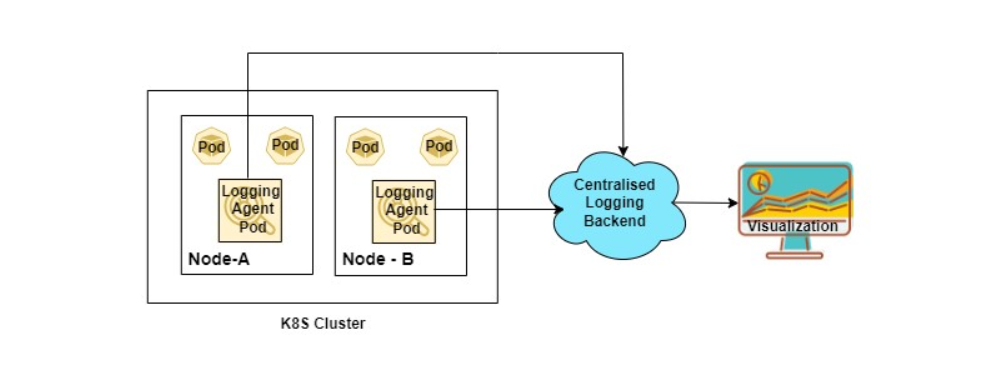
Due to these layers of abstractions, there are multiple components needed. The above logging architecture diagram has the following components
Logging Agent: These are generally deployed as DaemonSet in the cluster to collect node and application level logs. The aggregated logs are then sent to centralized locations. Some of the examples of logging agents are FluentBit, Vector, Logstash etc.
Centralized Backend: It stores, indexes, searches and analyzes the log data such as Elasticsearch, Grafana Loki.
Visualization: It is used to visualize log data on the dashboard, such as Grafana, Kibana
Application or Pod Level Logs
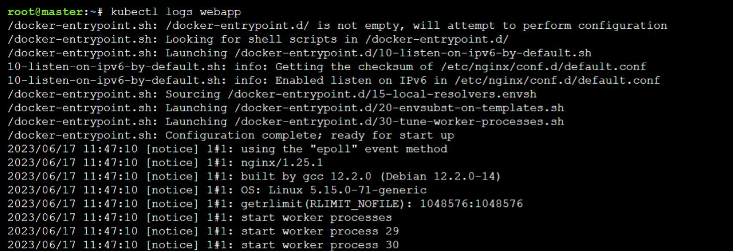
The logs of the applications running as a pod inside the Kubernetes cluster can be seen with kubectl. For example, let’s create a Nginx web server pod and observe its logs.
kubectl run webapp --image=nginx
kubectl logs webapp
You should see the logs of the nginx web server, like below.
If multiple containers run in the pod, specify the container's name with -c flag.
kubectl logs <pod-name> -c <container-name>
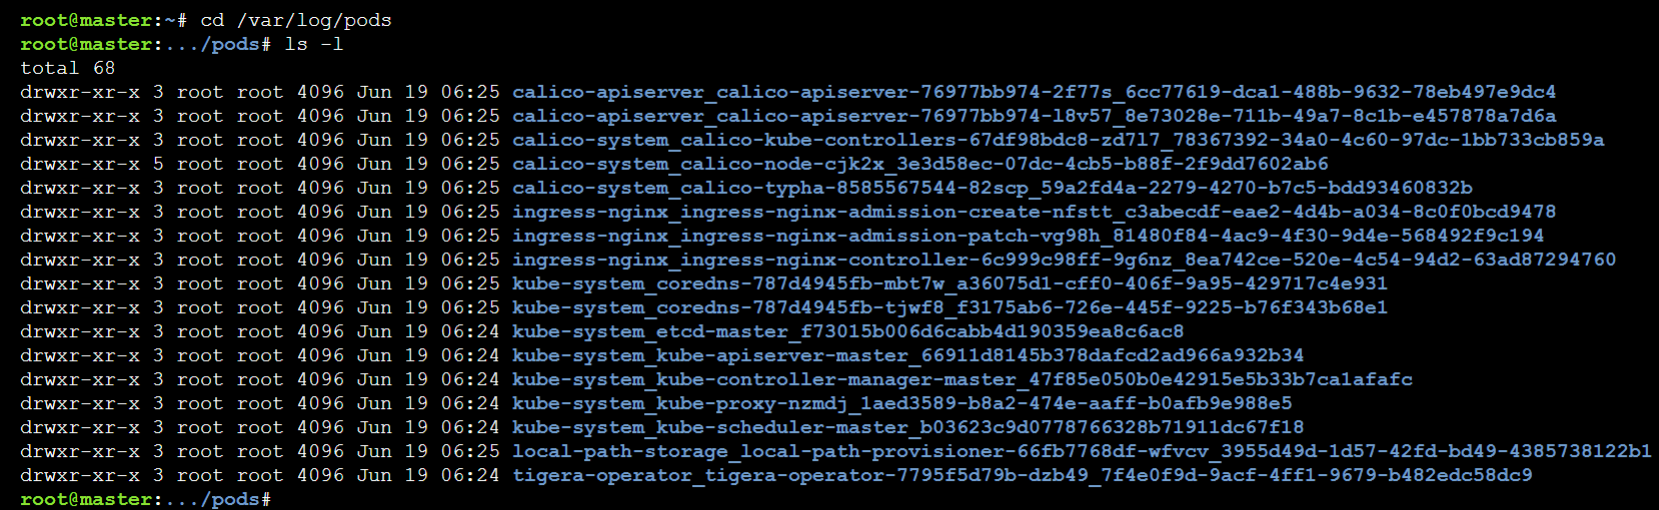
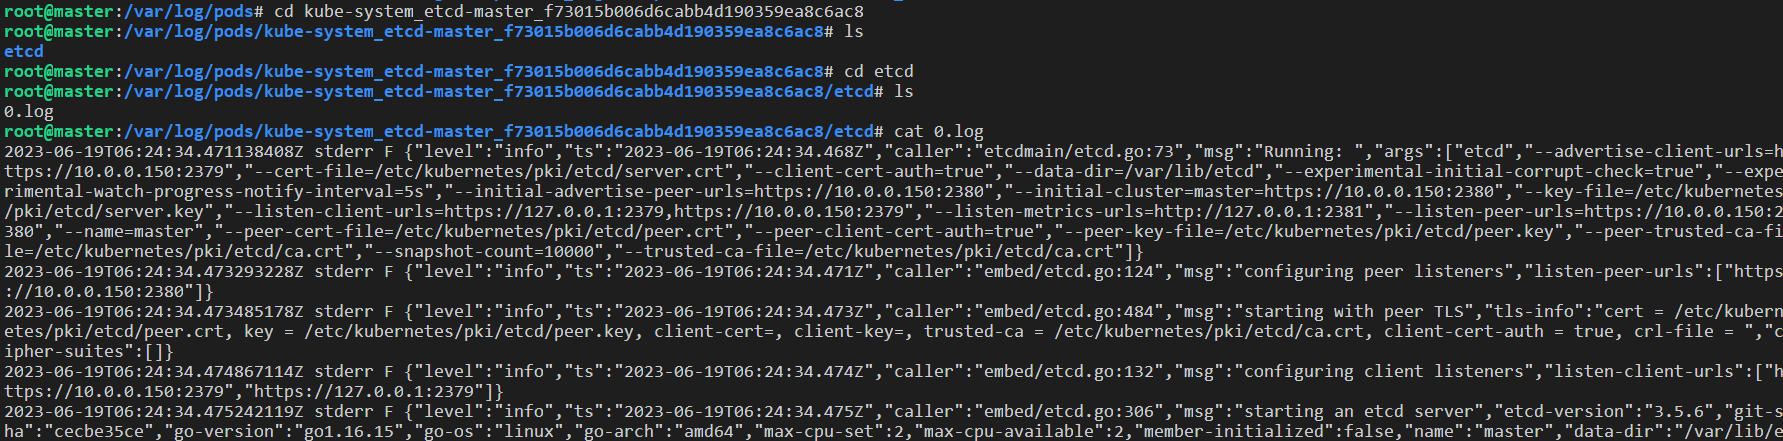
You can also directly access the log files by logging on to the node. Logs files are stored at /var/log/pods and /var/log/containers, respectively, on nodes. The files present in /var/log/containers are soft links to their respective /var/log/pods/<namespace_podname> folder.
If the container restarts, kubelet is responsible for keeping track of logs at the node level. Also, when a pod is evicted from the node, its container and respective logs are evicted. After logging in to the node, run ls to see the list of pods and containers.
ls -l /var/log/pods
To check any pod’s and it’s respective container logs, run:
cat <namespace_pod_name>/<container_name>/<file-name>.log
Node Level Logs
Logging at the node level differs from the application level as it will also contain all the information related to node infrastructure. It would contain the following per node.
- Kernel Logs
- Systemd Logs
- Other OS Logs
To view the Kernel and the Systemd logs at node level with journald, you can use the journalctl command. Output of the command will be similar to below.
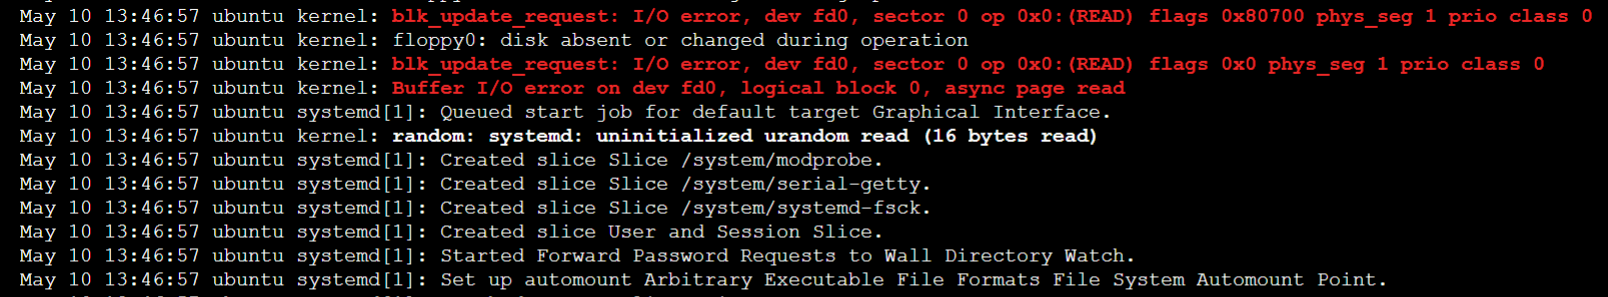
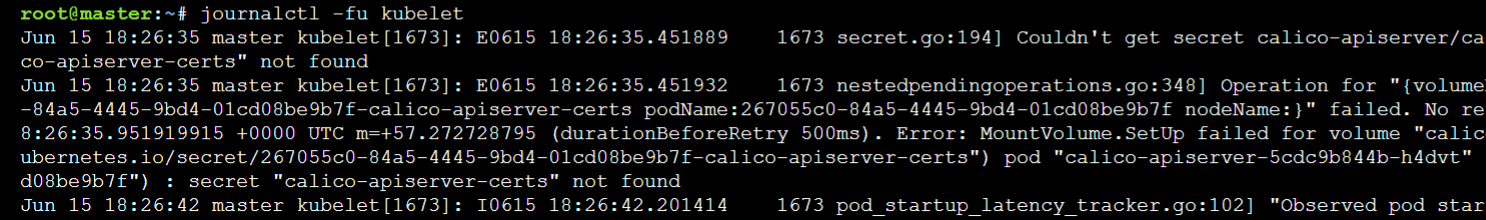
To view the logs of a specific service such as kubelet, which is also a part of Kubernetes per node component
journalctl -fu kubelet
To get the other system-level logs that cannot be checked from the above two, can be found at /var/log/ location. For example, the access and error logs of nginx web server
ls /var/log/nginx
cat /var/log/nginx/access.log
cat /var/log/nginx/error.log
We can collect the node level and application level logs using the log agents such as FluentD or Logstash which will have access to all the log files and directories. We can either run them on a specific node or as a DaemonSet on all nodes of the cluster depending on the use case.
Cluster Level Logs
The cluster-level logs are the logs from
- The applications running inside the Pods
- Nodes of the cluster
- Control-plane components.
The first two we discussed above. As the Kubernetes cluster components are running as pods, the logs collector agent would collect the logs of the API Server and the other control-plane components; whereas kubelet logs are collected via systemd.
Apart from above we can use following to get additional details,
- Kubernetes Events
- Audit Logs
Kubernetes Events
Kubernetes events store information about the object state changes and errors. Events are stored in the API server on the control-plane node.
To get event logs
kubectl get events -n <namespace>
We can also get events from a particular pod
kubectl describe pod <pod-name>
Check the events at the end of the output.
To avoid using all disk space on the control-plane node, Kubernetes removes events after one hour.
Audit Logs
The audit log is detailed information about all the actions that happened in the cluster. It tracks all the activities in a sequence. It is used for security purposes to know who did what, when, and how? The audit policy has to be enabled to the master node only. Please refer to the Auditing lab to understand audit logs in detail.
Logging Pipeline
The Logging pipeline consists of collecting logs from different pod applications, aggregating and shipping them in the backend, where logs are stored . It is then used further for analysis and visualization. The logging pipeline is further divided into:
Logging Libraries: The first step for proper logging setup is a logging library. Typically the application development team chooses a logging library at the start of project. The decision is generally based on the programming language, memory allocation preferences, format availability (text, JSON etc) among others. Read more about logging libraries.
Logging Agents and Forwarders: Next in the process is a logging agent or forwarder. Both agents and forwarders collect logs from application output (e.g. log file or console) and forward them to a central location - hence these terms are used interchangeably, but there are subtle differences. Read more about logging agents and forwarders.
Logging Platforms: Logging platforms are the final step in a logging pipeline. These platforms are responsible for ingesting logs from forwarders and/or agents, storing them in a reliable and scalable manner and providing a powerful interface for text search or analytics as relevant. Read more about logging platforms.
Parseable
Parseable is an open-source, lightweight, cloud-native log observability engine written in Rust. It uses Apache Arrow and Parquet for easy access to data. It uses an index-free mechanism to organize and query data with low latency. It can be deployed anywhere. It is being designed stateless to make it compatible with cloud-native systems.
Kubernetes Logging Best Practices
As far as we discussed in detail, logging in Kubernetes at each level and some of the logging tools. But while using it, one has to be assured about using it efficiently with minimum resource utilization. So below are some of the best practices to use logging in Kubernetes:
- Setting up the Logging System
- Write Logs to stdout and stderr
- Standard Logging Libraries
- Limit Log Volume with the log rotation policy
- Use independent cluster for development and production
We will publish a hands-on Lab to elaborate more on Kubernetes logging best practices in the future.
Conclusion
Logging plays a key role in debugging and troubleshooting the issues in the Kubernetes cluster. It may be easy to find and solve the issues easily if developers are familiar with the logging mechanism and how to use them. This hands-on lab discussed logging in Kubernetes, its types, and an overview of different logging tools with some of the best practices.