
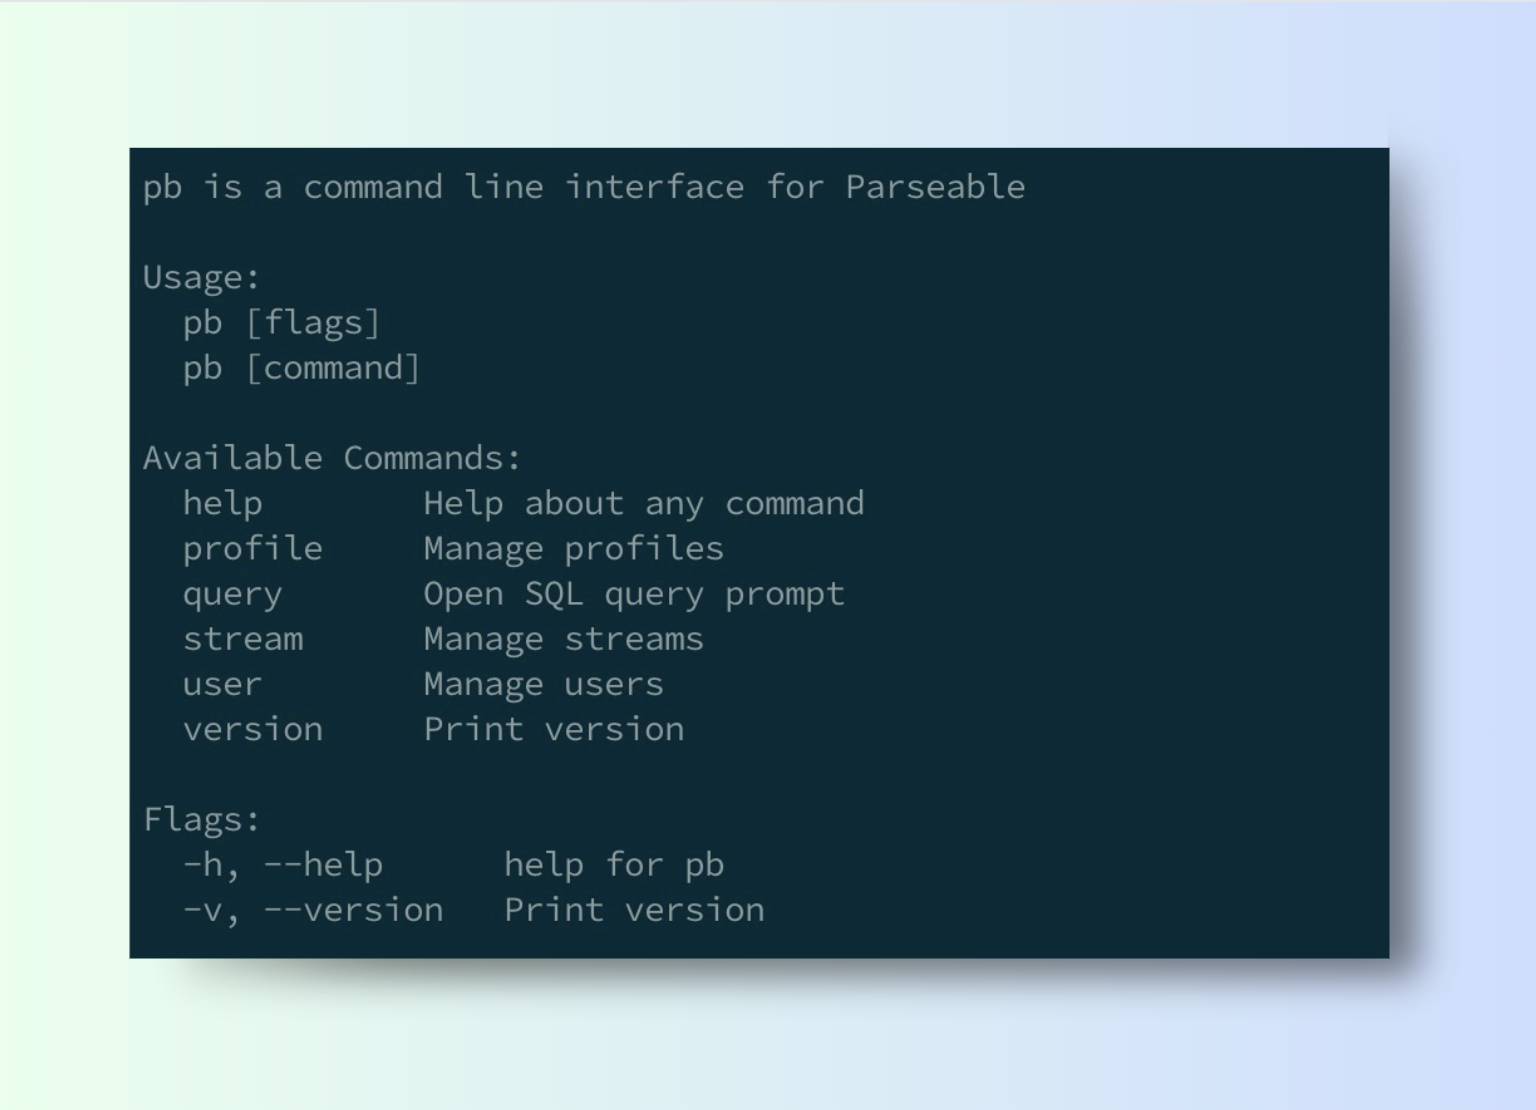
pb is a command line tool designed to fit developer's toolkit and help debug issues faster. You can point pb to a Parseable for instance, query and analyze logs, directly from the comfort of command line. The focus is to meet the users where they are, and not force them to switch contexts into different dashboards. pb is written in Go and available as a single static binary for all the major platforms.
Here's the link to the project. You can download the latest version from here, for the platform of your choice.
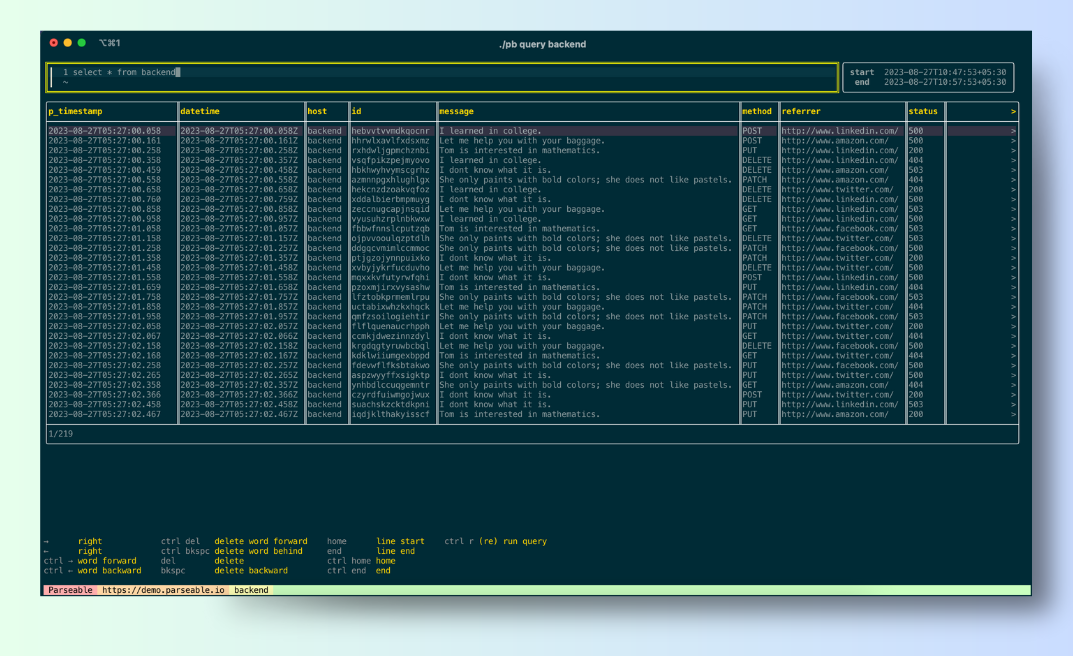
For example, please see below for the exact commands to run on Linux. Note that out of the box, pb is configured with demo profile, pointing to the demo Parseable instance. So, you can directly run the query command without setting up a profile.
wget https://github.com/parseablehq/pb/releases/download/v0.1.0/pb_linux_amd64 -O pb
chmod +x pb && mv pb /usr/local/bin
pb query backend
To point pb to your own Parseable instance, use the pb profile command as shown below.
pb profile add parseable-local http://localhost:8080 <username> <password>
pb profile default parseable-local
Once added to the profile and set default, you can now use various pb commands against your Parseable instance.
Why pb?
Logging has been primarily dashboard driven, and in most of the cases dashboards serve the purpose well. However, for developers specifically, we see a lot of push back on using dashboards for debugging issues. The push back generally appears in the form of poor buy-in of logging and observability tools.
We believe dashboard fatigue is a major reason for this, and we want to solve this problem by bringing modern, unified log analytics to developer's terminals. We want to make developers feel at home when debugging issues arrive, and not have to switch contexts to different dashboards.
Features
pb's first release ships with several features, including:
- Profile management to manage multiple Parseable instances from the same pb binary.
- User management that allows to create, list, delete, and assign roles.
- Stream management lets user to create, delete, and list streams.
- The most important, SQL based query prompt that enables user to run SQL queries directly on log streams.
Roadmap
The goal of building pb is to bring modern, unified log analytics to developer's terminals. We aim to make developers feel at home while debugging issues, and not have to switch contexts to different dashboards.
In the upcoming months users will be able to use pb with tools like awk, grep etc. which will allow you to pipe the output of pb to these tools and use them to further analyze the logs.
Additionally, we're working on live tailing support, so users can tail the logs directly from the command line. This will be beneficial for debugging issues in real time.
We'll also add saved queries so users can save and load queries from the command line. This will make it easier to share queries with team members.
Conclusion
pb is a command line tool designed to fit into a developer's toolkit and help them debug issues faster. It's designed to meet the users where they are, and not force them to switch contexts into different dashboards.
If you love terminal based tools, you'll love pb. Download the latest version from here.
If there is a feature request? Please open an issue, or join the Parseable community on Slack.