
Introduction
Traditionally Linux kernel has been one of the best places to implement security and observability features, but also very difficult in practice, because you can't add new features to the kernel. eBPF changes this by securely enhancing the Kernel functionality at runtime. eBPF allows sandboxed programs to be executed in the Linux kernel without changing the kernel source code or requiring a reboot. It extends the Linux kernel at runtime.
This means, now you have the power of the Linux kernel at your fingertips. You can write programs that can be executed in the kernel, and you can do it without changing the kernel source code or requiring a reboot.
Logging is one of the key benefactors of this new technology. You can now enable kernel level log observability with eBPF - capture events like network access, file access and much more. This is a game changer for cloud native applications, as it allows you to get deep insights into your application, without having to change your application code.
In this post, we'll explore the integration of Tetragon with Parseable. We'll also examine a very specific use-case for auditing and alerting sensitive file access in Kubernetes.
- Tetragon is an open-source project of Cilium that provides runtime security, deep observability, and kernel-level transparency using eBPF.
- Parseable is a lightweight, high-performance log analytics stack for developers.
- Vector is lightweight, ultra-fast tool for building observability pipelines.
Here is the high-level architecture used in this post.
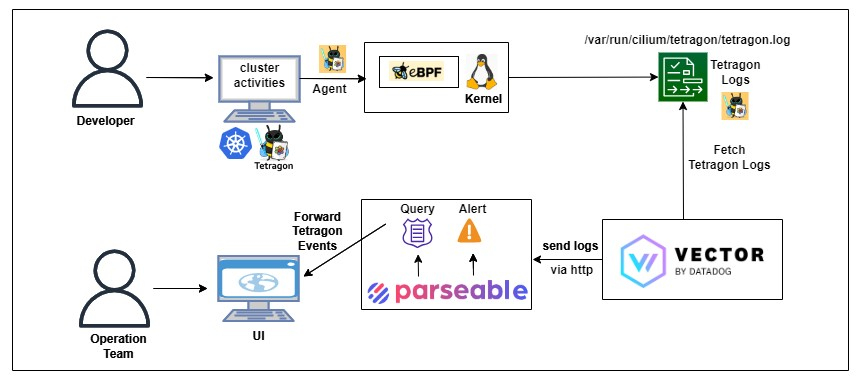
- Enable Tetragon in the Kubernetes cluster to store logs locally.
- Send Tetragon logs to Parseable through Vector.
- Access sensitive files from a Kubernetes pod to trigger alerts via Parseable.
What is Tetragon?
Tetragon is a robust Kubernetes-aware security observability and runtime enforcement tool that applies TracingPolicy and filtering directly through eBPF. It reduces observation overhead by tracking any process and enforcing real-time policies.
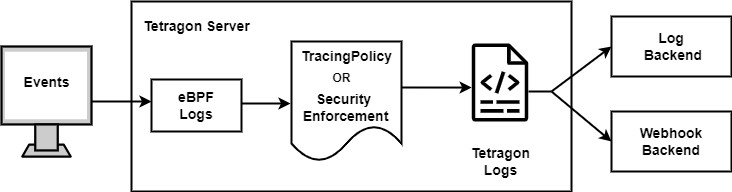
As illustrated above, Tetragon is deployed in the Kubernetes cluster. It uses eBPF hook points to observe kernel calls. When a TracingPolicy is applied, it filters logs as per the policy configuration. Filtered events are then stored locally or sent to a webhook backend like Parseable. For more details, you can refer to Auditing eBPF Programs with Tetragon.
Pre-requisites
To get started, you'll need the following pre-requisites:
- A Kubernetes cluster with admin access. If you don't have one ready, you can create it using Minikube or Kind.
- kubectl installed on your local machine.
We'll implement Tetragon logs using TracingPolicy. The Tetragon server stores them in a local file system and configures Vector, a lightweight, ultra-fast tool, to send logs to the Parseable server. Finally, we'll verify Tetragon logs in the Parseable UI for sensitive file access via a Kubernetes pod.
Install Tetragon
We will install Tetragon using Helm.
helm repo add cilium https://helm.cilium.io
helm repo update
helm install tetragon cilium/tetragon -n kube-system
Wait for a moment, then
kubectl get ds tetragon -n kube-system
kubectl logs -n kube-system -l app.kubernetes.io/name=tetragon -c export-stdout -f
Optional:
For a better event format, you can install Tetra CLI:
curl -L https://github.com/cilium/tetragon/releases/latest/download/tetra-linux-amd64.tar.gz | tar -xz
sudo mv tetra /usr/local/bin
Then, observe the events with the tetra command:
kubectl logs -n kube-system -l app.kubernetes.io/name=tetragon -c export-stdout -f | tetra getevents -o compact
Install Parseable
As explained in the beginning, Parseable is a lightweight, high-speed logging and observability platform for cloud-native applications. Follow this installation guide to install Parseable on your Kubernetes cluster.
Wait for Parseable to start, and then verify that Parseable pods are running in the parseable namespace.
kubectl get pods -n parseable
With the application ready and port exposed, we'll use the Vector agent to configure Tetragon logs as its data source and send them to the Parseable server.
Install Vector
Install Vector through Helm. We have a vector-tetragon-values.yaml file configured to access the tetragon.log file.
helm repo add vector https://helm.vector.dev
wget https://www.parseable.com/blog/vector/vector-tetragon-values.yaml
helm install vector vector/vector --namespace vector --create-namespace --values vector-tetragon-values.yaml
It will take a few minutes for the Vector pod to get started. Verify the vector pod is running in a vector namespace.
kubectl get pods -n vector
Now Vector is ready to send the events stored in /var/run/cilium/tetragon/tetragon.log file to the Parseable tetrademo log stream. Once this is done, you can verify the log events in Parseable UI.
Track sensitive file access with Parseable
Although integrating Tetragon logs with Parseable has several advantages, we will concentrate on one of the most notable use cases - auditing Tetragon events when accessing sensitive files like /etc/shadow.
Create a Pod to access files on the host
- Create a pod with privileged access.
# dev-pod.yaml
apiVersion: v1
kind: Pod
metadata:
  name: dev-pod
spec:
  containers:
    - command:
        - /nsenter
        - --all
        - --target=1
        - --
        - su
        - "-"
      image: alexeiled/nsenter:2.34
      name: nsenter
      securityContext:
        privileged: true
      stdin: true
      tty: true
  hostNetwork: true
  hostPID: true
kubectl apply -f dev-pod.yaml
- To list the pods,
kubectl get pods
The next step is to apply policy on Tetragon logs so it will extract particular types of logs.
Apply TracingPolicy
- Apply TracingPolicy for read/write access.
wget https://github.com/cilium/tetragon/blob/main/examples/tracingpolicy/filename\_monitoring\_filtered.yaml
This policy monitors a specific file, /etc/passwd. If you check the content of the TracingPolicy file, it hooks on kernel functions from which the file can be accessed:
security_file_permissionsecurity_mmap_filesecurity_path_truncate
kubectl apply -f filename_monitoring_filtered.yaml
This TracingPolicy will extract read/write event logs.
Access sensitive files from a Pod
Now, exec into the dev-pod and apply the cat command to read /etc/passwd file,
kubectl exec -it dev-pod -n default -- cat /etc/passwd
You can verify the logs from the Parseable Console. Next, we will generate an alert in the Parseable to get a notification when a sensitive file is accessed.
Set an alert in Parseable
Parseable allows us to generate an alert when the /etc/shadow file is read from the pod.
- Use the following JSON code to set an alert from the Parseable UI. Click console->config->alert.
To generate an alert for a specific pod,
{
  "version": "v1",
  "alerts": [
    {
      "name": "Unauthorised access",
      "message": "/etc/shadow file is accessed by an unauthorised pod",
      "rule": {
        "type": "composite",
        "config": "(process_kprobe_process_arguments =% \"shadow\")"
      },
      "targets": [
        {
          "type": "webhook",
          "Endpoint": "<webhook.site_custom_endpoint>",
          "skip_tls_check": false,
          "repeat": { "interval": "10s", "times": 5 }
        }
      ]
    }
  ]
}
This alert will trigger when the /etc/shadow file is accessed from the pod. Set up the target endpoint by going through https://webhook.site and copying your unique URL. Paste it in place of webhook.site_custom_endpoint
Click the Submit button.
Now, let's verify how the above Parseable setup triggers an alert. exec into the dev-pod and apply the cat command to read the /etc/passwd file and check the unique URL to see the alerts:
kubectl exec -it dev-pod -n default -- cat /etc/passwd
Open the unique URL again in a new tab for getting alert messages.
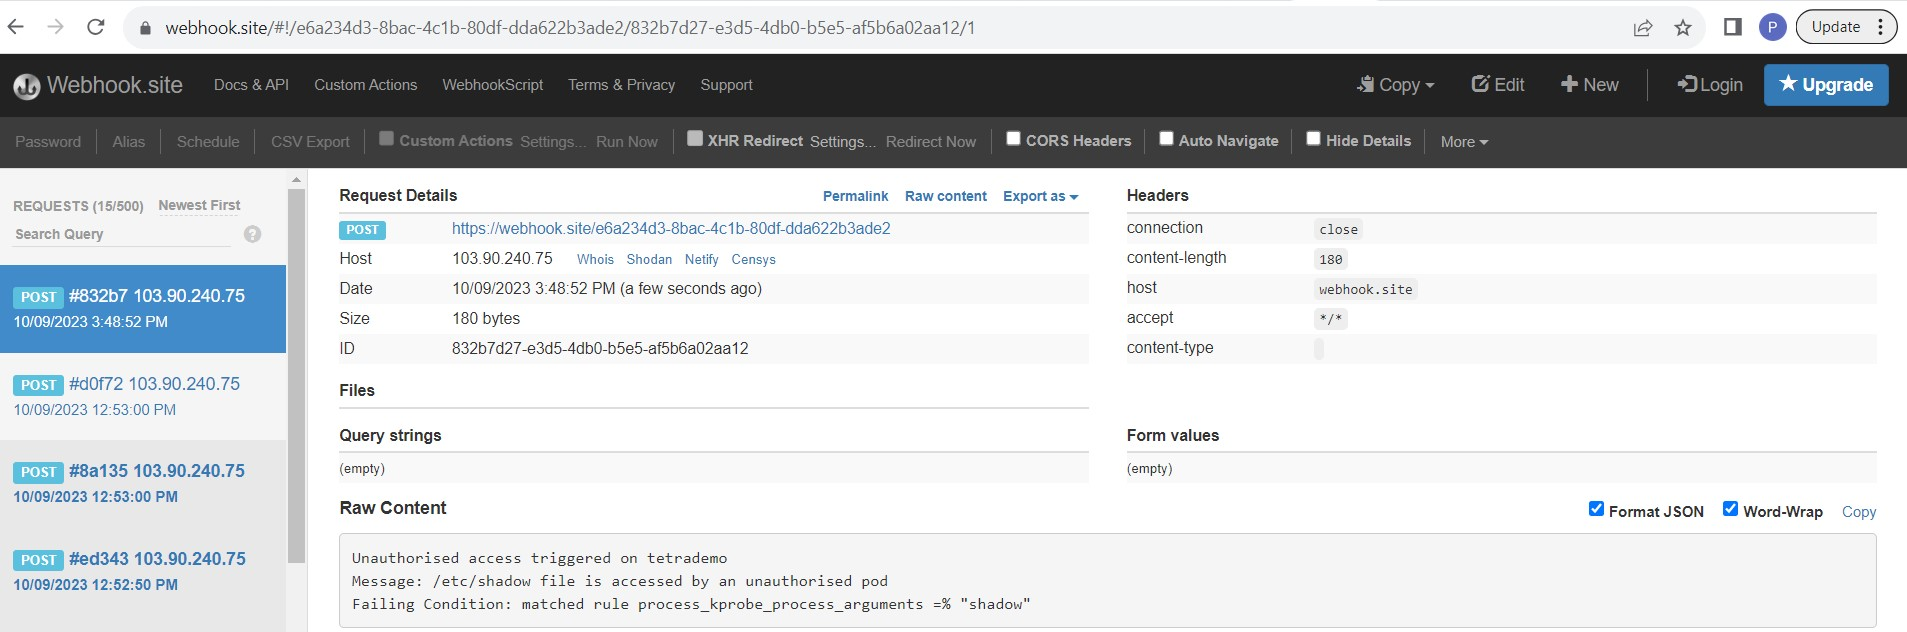
You can see the message "Unauthorized access" triggered in tetrademo as shown in the screenshot above. This is how the cluster admin can identify unauthorized access in the cluster and address it promptly.
Alert for multiple sensitive file access
In filename_monitoring_filtered.yaml add the following lines in the values field of all three functions.
- "/etc/shadow"
- "/etc/group"
- "/etc/gshadow"
kubectl exec -it dev-pod -n default -- cat /etc/shadow
kubectl exec -it dev-pod -n default -- cat /etc/group
kubectl exec -it dev-pod -n default -- cat /etc/gshadow
Then use this JSON code to set up an alert in the Parseable UI. Click console -> config -> alert.
To generate an alert for a specific pod:
{
  "version": "v1",
  "alerts": [
    {
      "name": "Unauthorised access",
      "message": "/etc/shadow file is accessed by an unauthorised pod",
      "rule": {
        "type": "composite",
        "config": "(process_kprobe_process_arguments =% \"shadow\")"
      },
      "targets": [
        {
          "type": "webhook",
          "endpoint": "https://webhook.site/e6a234d3-8bac-4c1b-80df-dda622b3ade2",
          "skip_tls_check": false,
          "repeat": {
            "interval": "10s",
            "times": 5
          }
        }
      ]
    },
    {
      "name": "Unauthorised access",
      "message": "/etc/gshadow file is accessed by an unauthorised pod",
      "rule": {
        "type": "composite",
        "config": "(process_kprobe_process_arguments =% \"gshadow\")"
      },
      "targets": [
        {
          "type": "webhook",
          "endpoint": "https://webhook.site/e6a234d3-8bac-4c1b-80df-dda622b3ade2",
          "skip_tls_check": false,
          "repeat": {
            "interval": "10s",
            "times": 5
          }
        }
      ]
    }
  ]
}
This will generate alerts when the specified files are accessed from the pod. Remember to set up the target endpoint with your unique URL from https://webhook.site
Conclusion
In this post, we covered how Parseable fits into the Kubernetes ecosystem with Tetragon logs. We set up a Tetragon logging pipeline with Vector and Parseable, applied TracingPolicy, and generated alerts in Parseable when sensitive files were accessed.
Do you have further ideas or feedback you'd like to share? Join our Slack channel to start a conversation! We value your insights and look forward to hearing your thoughts and suggestions.
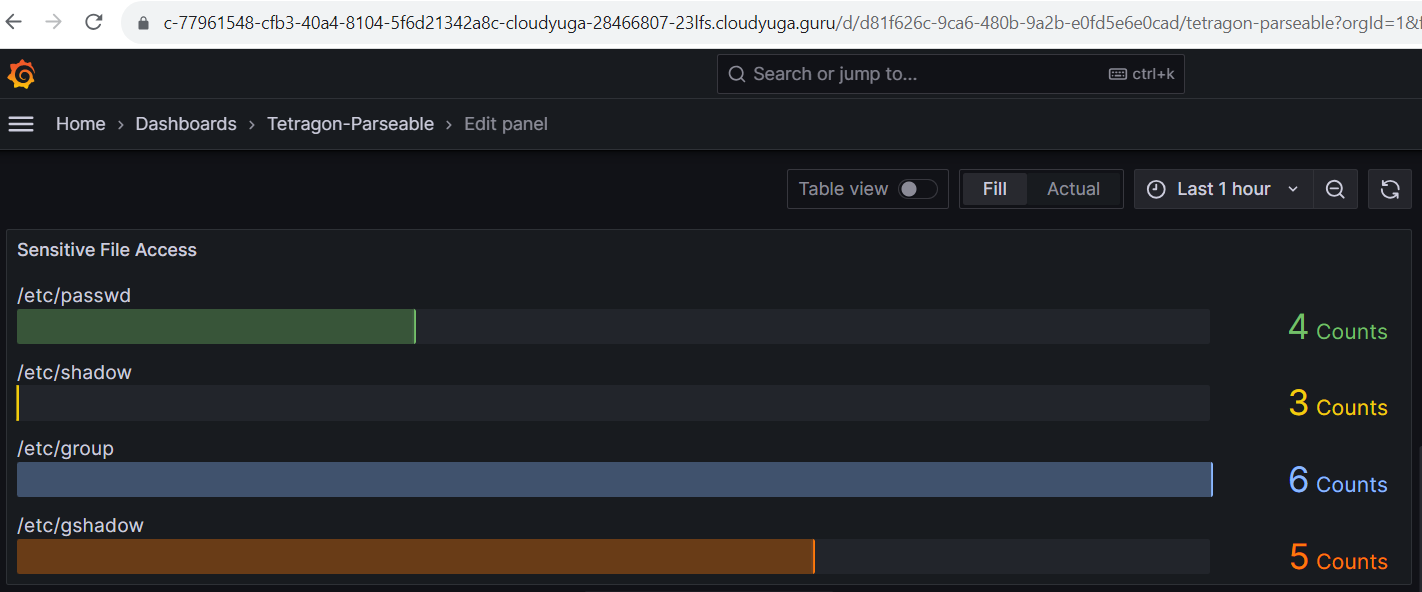
In our upcoming post, we can add better visualization using Grafana to display sensitive file access. We'll use the Parseable plugin for Grafana to achieve this.