Grafana Data Source
Parseable data source plugin allows you to query and visualize log data stored in Parseable server, in your Grafana dashboard.
Pre-requisites
- Parseable server setup and receiving logs from your application.
- Grafana installed and running.
Installation
There are several ways to install the plugin:
Grafana UI: Install the plugin from your Grafana instance (Configuration > Data sources > Add Data source). Add Parseable as a data source at the data source configuration page.
Grafana CLI: Install the plugin using the command
grafana-cli plugins install parseable-parseable-datasource. Then restart Grafana.Grafana Helm Chart: Install the plugin by modifying the Grafana Chart
values.yamlfile. Add the following lines underplugins:section.
plugins:
  # - digrich-bubblechart-panel
  # - grafana-clock-panel
  ## You can also use other plugin download URL, as long as they are valid zip ## files, and specify the name of the plugin after the semicolon. Like this:
    - https://grafana.com/api/plugins/parseable-parseable-datasource/versions/1.0.2/download;parseable-parseable-datasource
Add the following lines under datasources: section.
## Configure grafana datasources
## ref: http://docs.grafana.org/administration/provisioning/#datasources
##
datasources:
 datasources.yaml:
   apiVersion: 1
   datasources:
   - name: Parseable
     type: parseable-parseable-datasource
     url: http://parseable.parseable
     access: proxy
     isDefault: true
     basicAuth: true
     basicAuthUser: admin
     secureJsonData:
        basicAuthPassword: admin
Please remember to update the url, basicAuthUser and basicAuthPassword values with your Parseable server instance details.
If you're deploying Grafana and would like to install the plugin at the same time, you can use the
GF_INSTALL_PLUGINSenvironment variable. For example,GF_INSTALL_PLUGINS=parseable-parseable-datasource 1.0.2. Then restart Grafana.If you're provisioning Grafana using config management tools like Ansible, you can manage data sources in Grafana by adding YAML configuration files in the
provisioning/datasourcesdirectory. Refer Grafana documentation for more details.
Configuration
Configure the data source specifying URL and port like https://demo.parseable.com:443. Parseable supports basic auth, so toggle the
Basic Authoption underAuthsection and enter the username and password underBasic Auth Detailssection. If you're using Parseable demo server as the backend, useadmin,adminas the credentials.Push the Save and Test button, if there is an error message, check the credentials and connection.

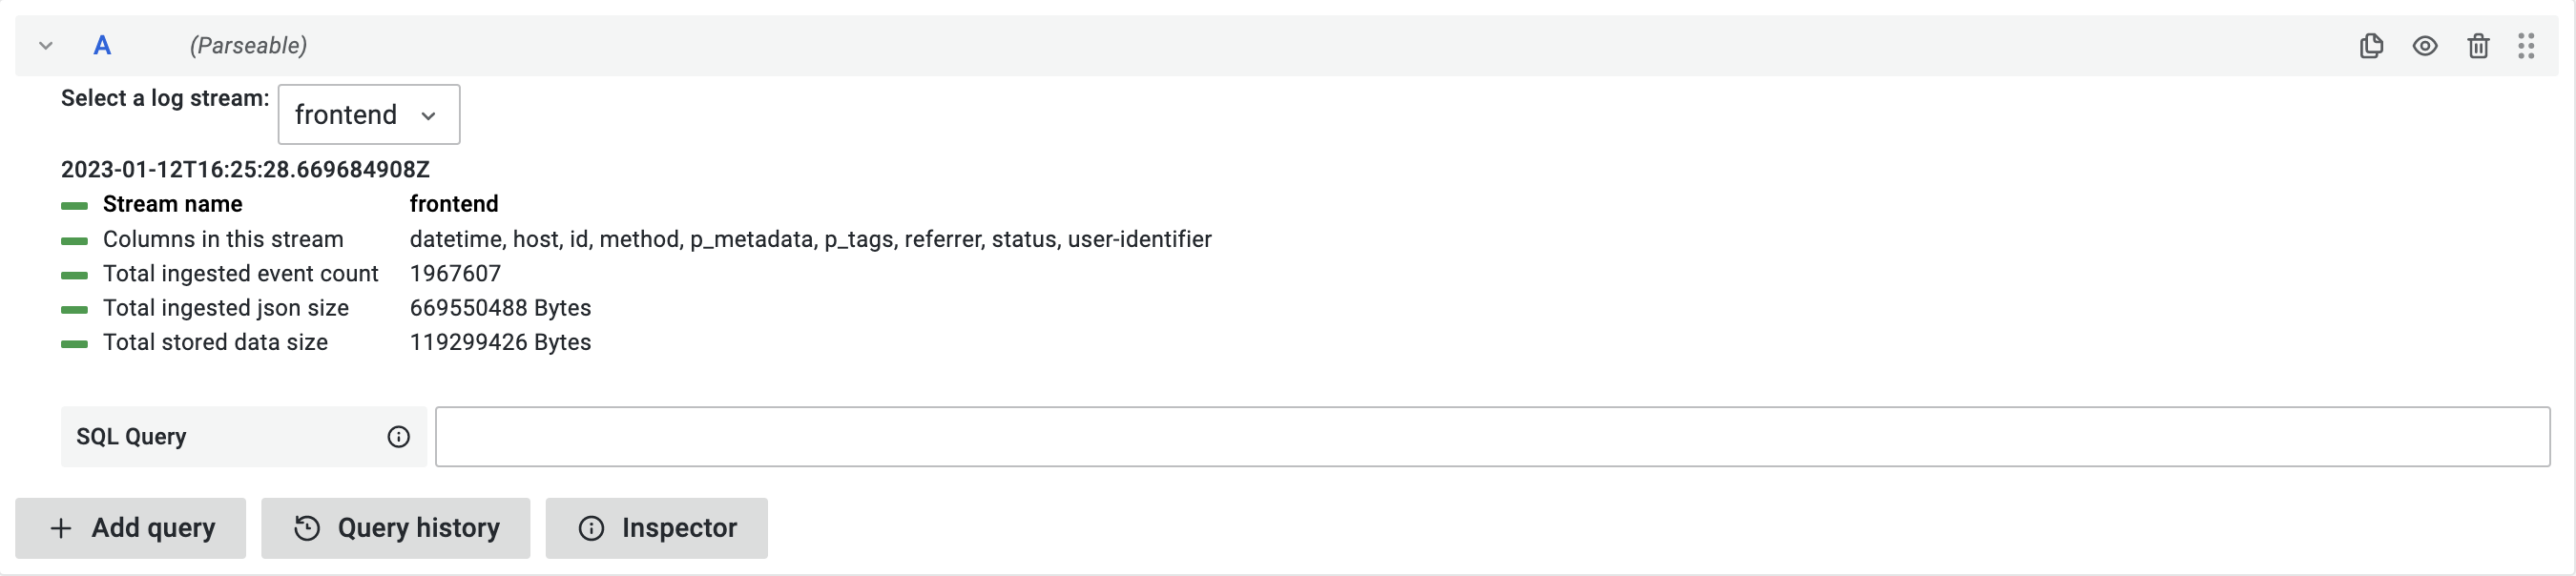
Usage
Once the plugin is configured with correct Parseable server instance. You can start using it to query and visualize logs. Use the query editor to write your own queries.
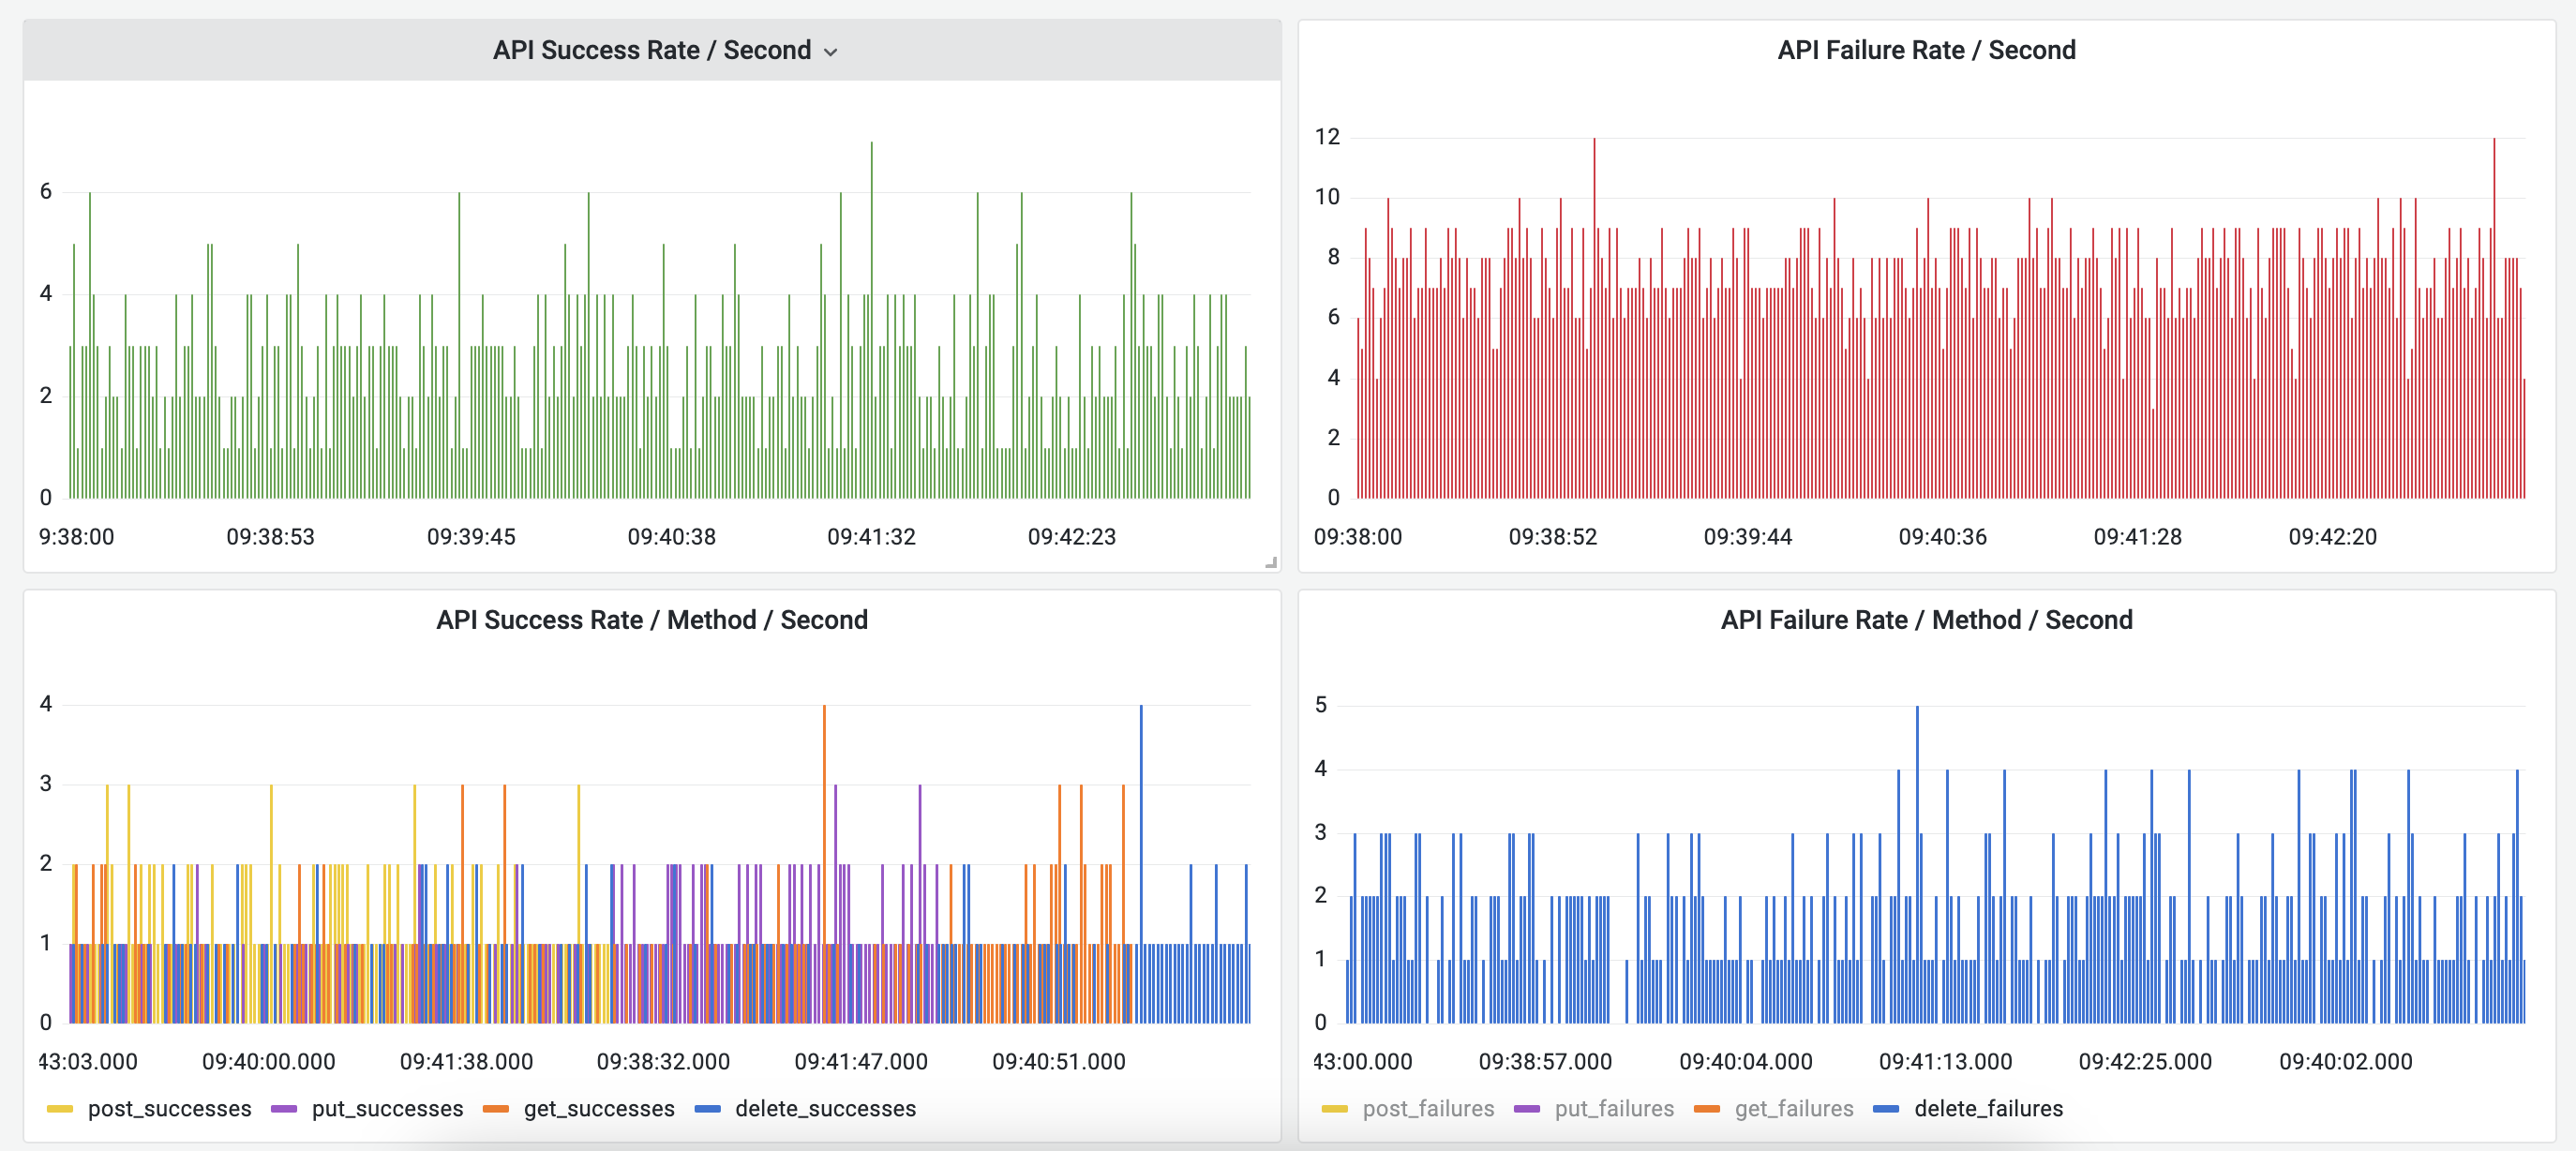
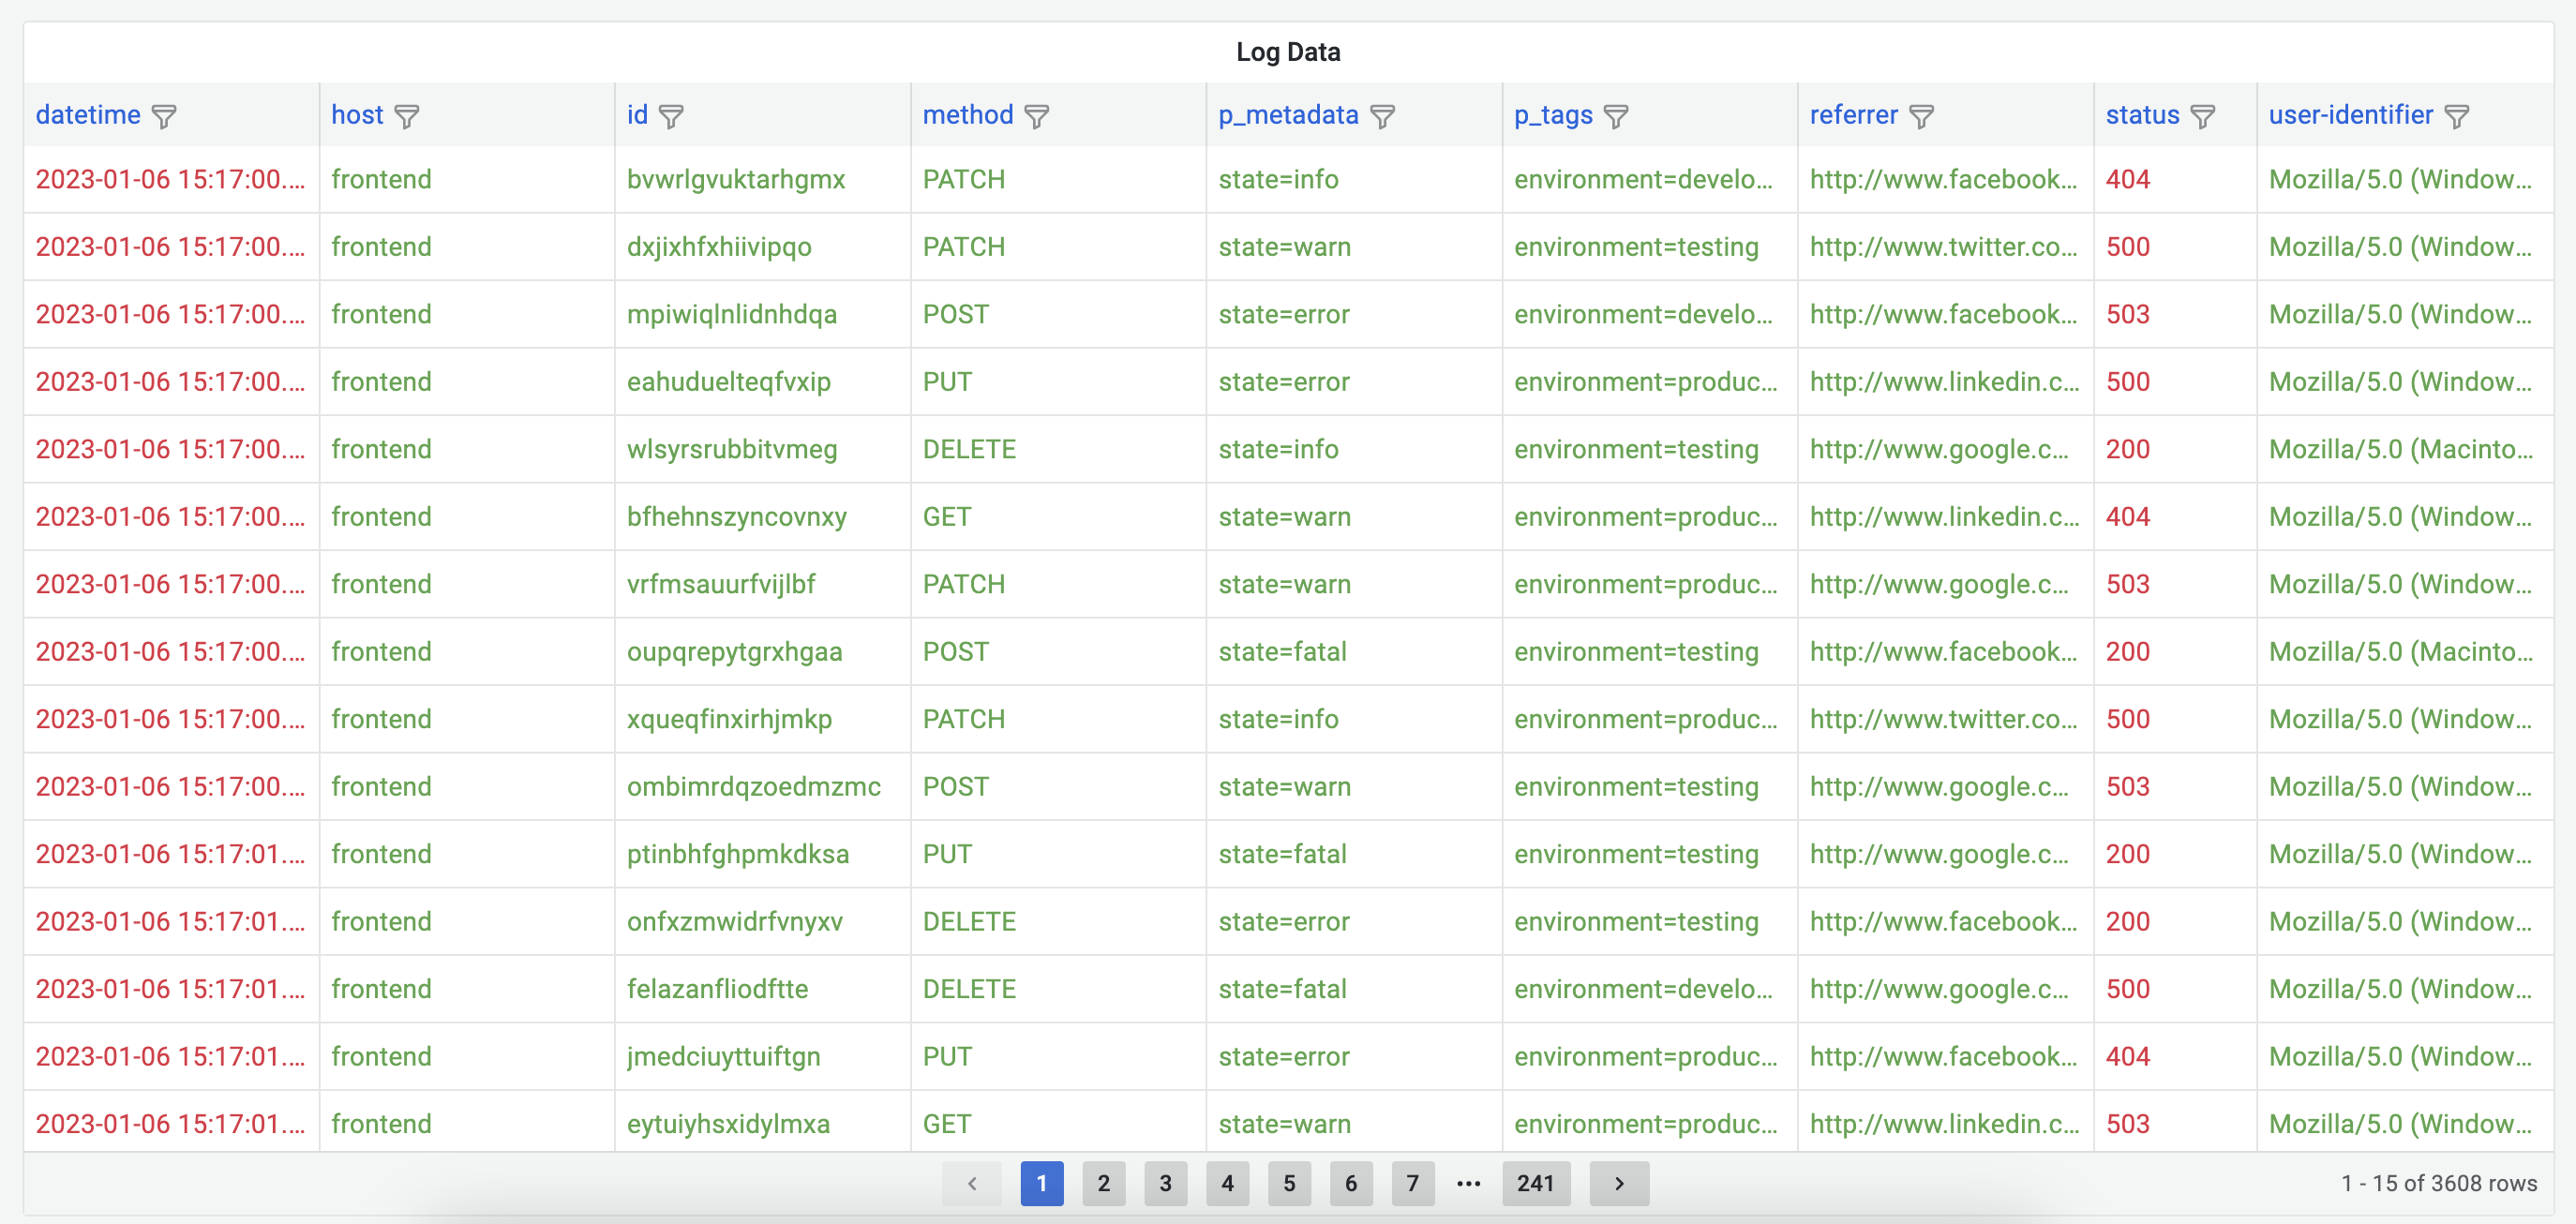
Sample Dashboard
Refer sample dashboard here: Grafana Dashboard Demo
Screenshots